-
Training & Coaching
-
Prospecting for Impact
-
Prospecting into Enterprise Accounts
-
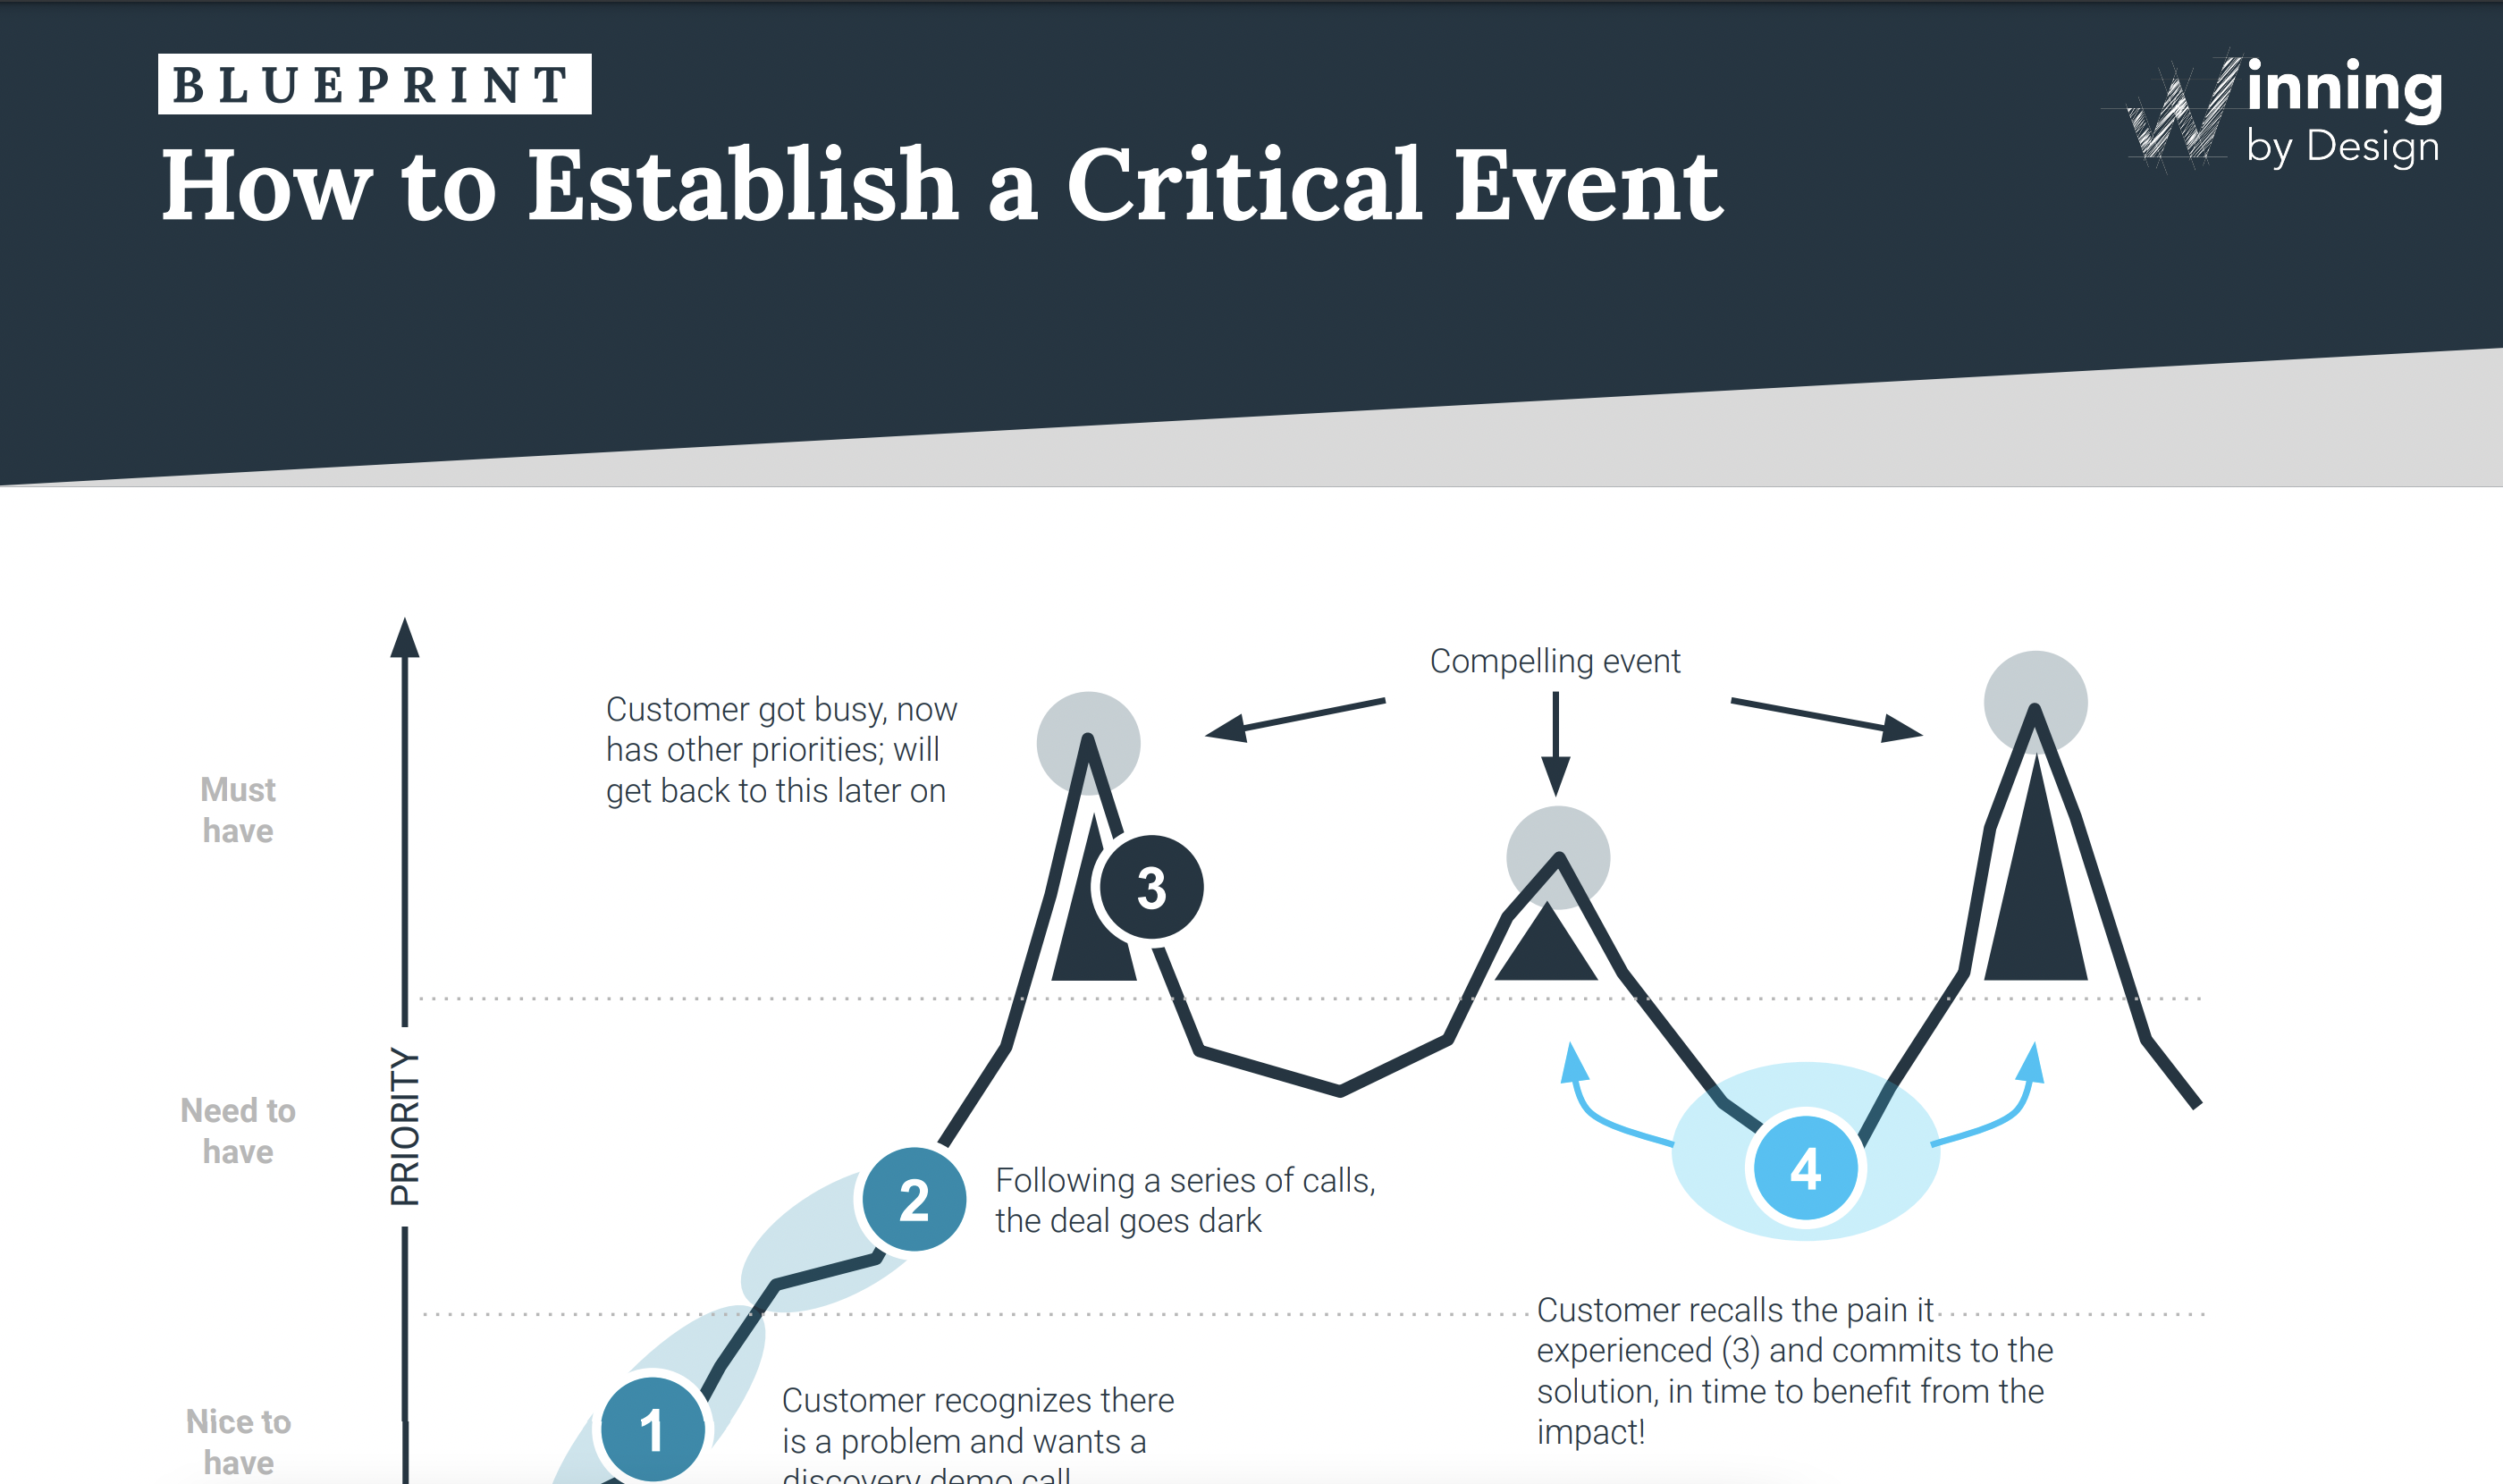
Selling for Impact
-
Selling into Enterprise Accounts
-
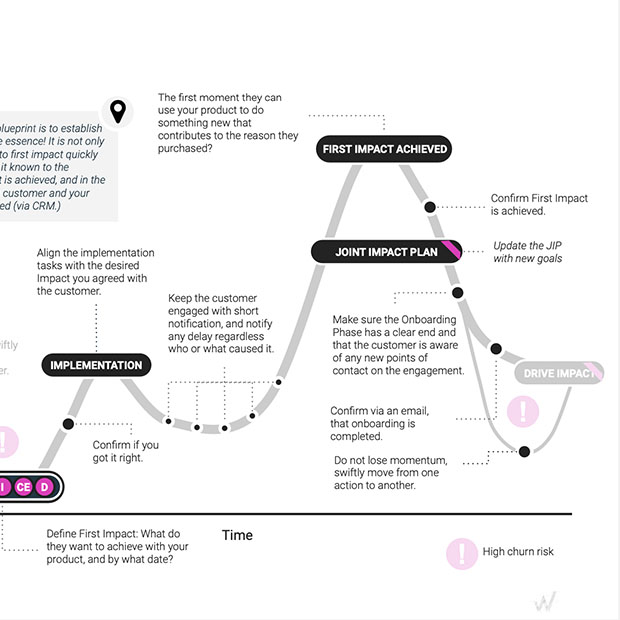
Customer Success for Impact
-
Account Management for Growth
-
Managing for Impact
-
Managing for Leadership
-
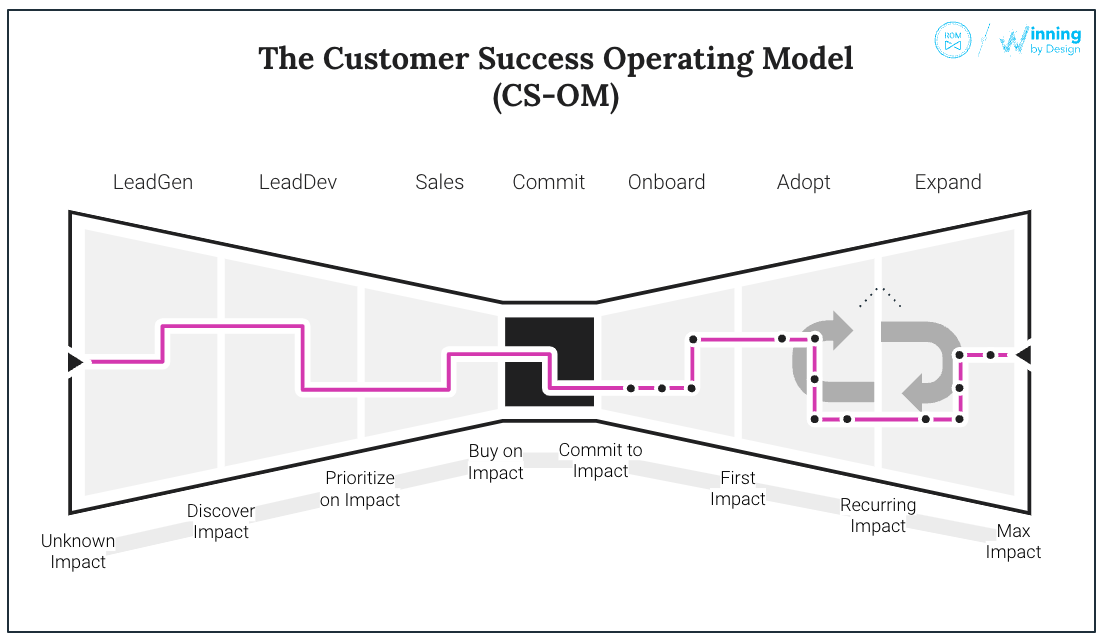
Revenue Architecture
-
Bowtie Analytics
-
Insight Engineering
-
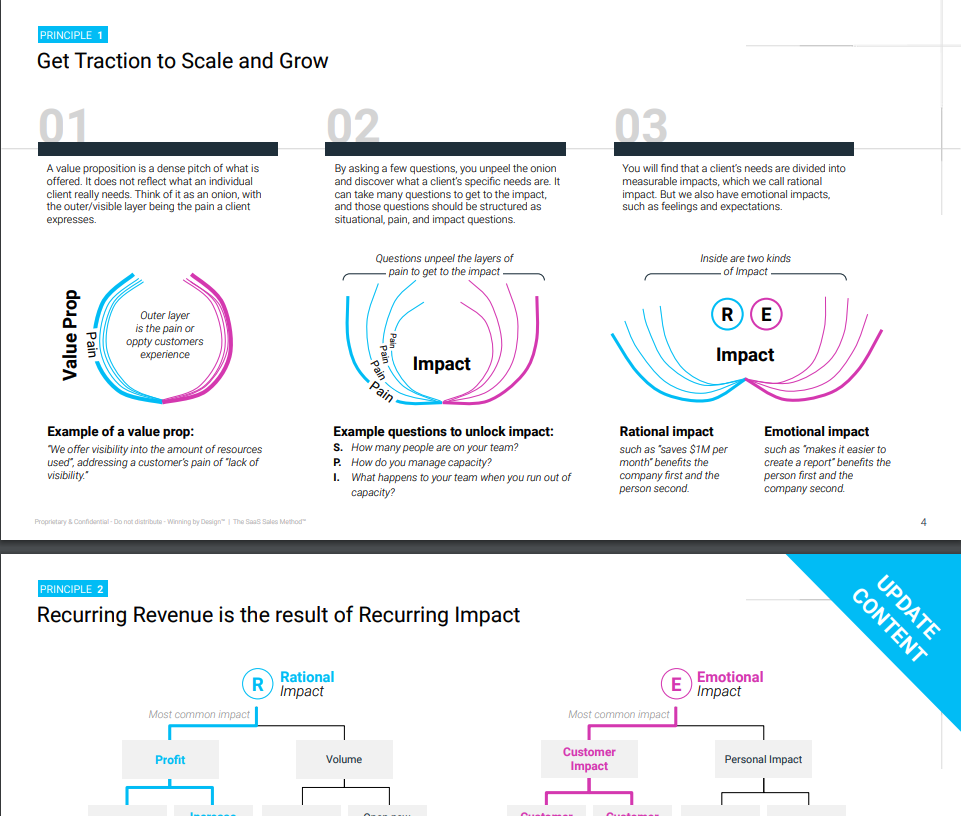
 Skills Course: Discovery Using SPICED
 -
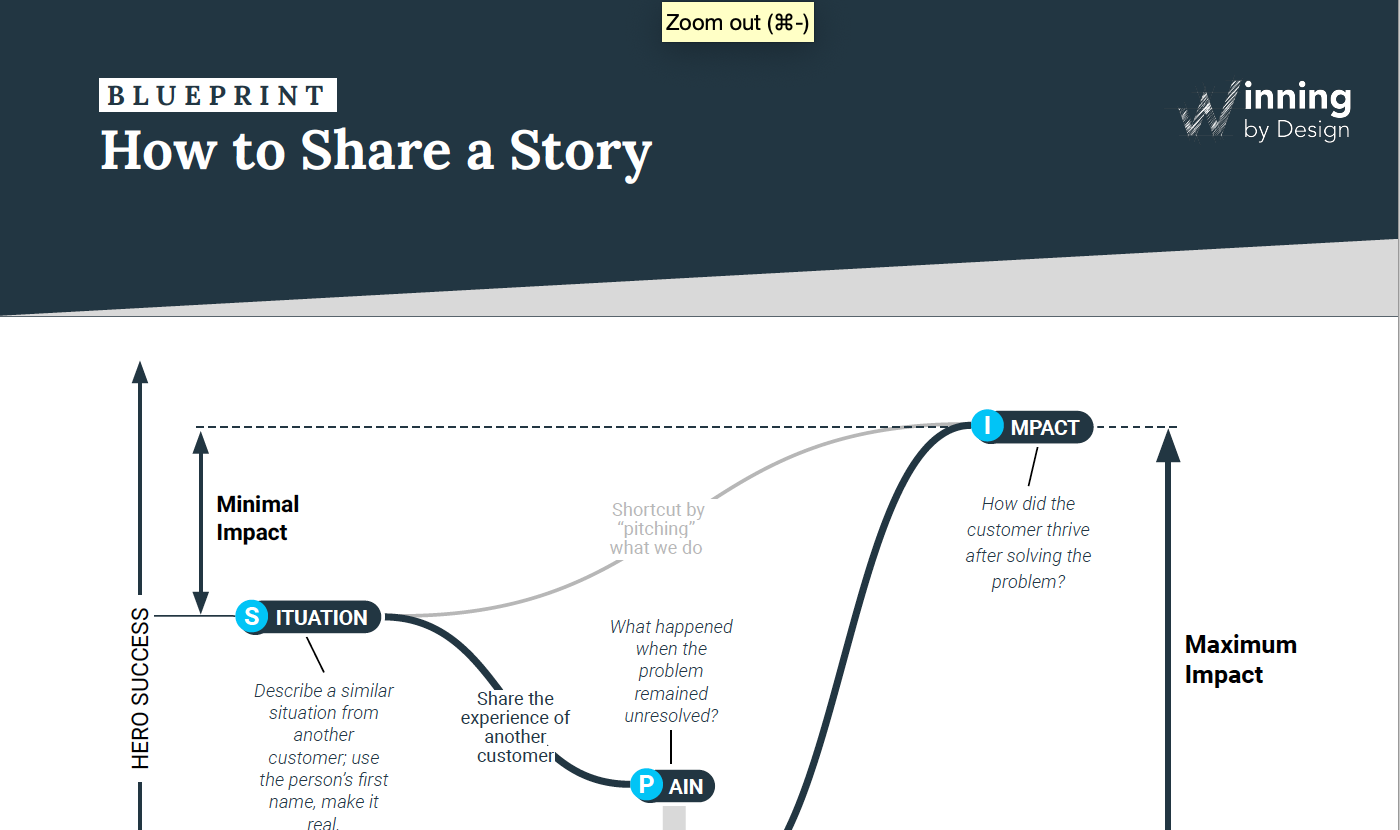
Skills Course: Storytelling
-
 Facilitator Certification
-
- Resources
Resources